How end-of-life software accumulates vulnerabilities
A conceptual article outlining the risk involved with using EOL software and how EOL images accrue vulnerabilities.
6 min read
For the complete documentation index, see llms.txt.
Chainguard provides CVE Visualizations for all of its container images. This feature creates reports with CVE comparisons between Chainguard Containers and popular alternatives, as well as historical CVE remediation metrics. CVE Visualizations provide insight into image health and can help teams measure the engineering, security, and economic benefits gained from using Chainguard Containers.
This guide outlines how you can access a container image’s CVE Visualization in both the Chainguard Console and in the Containers Directory.
You can find CVE visualizations in two places in the Chainguard Console: the Reports page in the left-hand navigation menu, and the Comparison tab of an individual image.
Select Reports in the left-hand navigation menu.
The Reports page has two tabs: Compare images and Organization comparison.
The Compare images tab compares one Chainguard Container with a popular alternative. It has three controls at the top:
Below the controls are these sections:
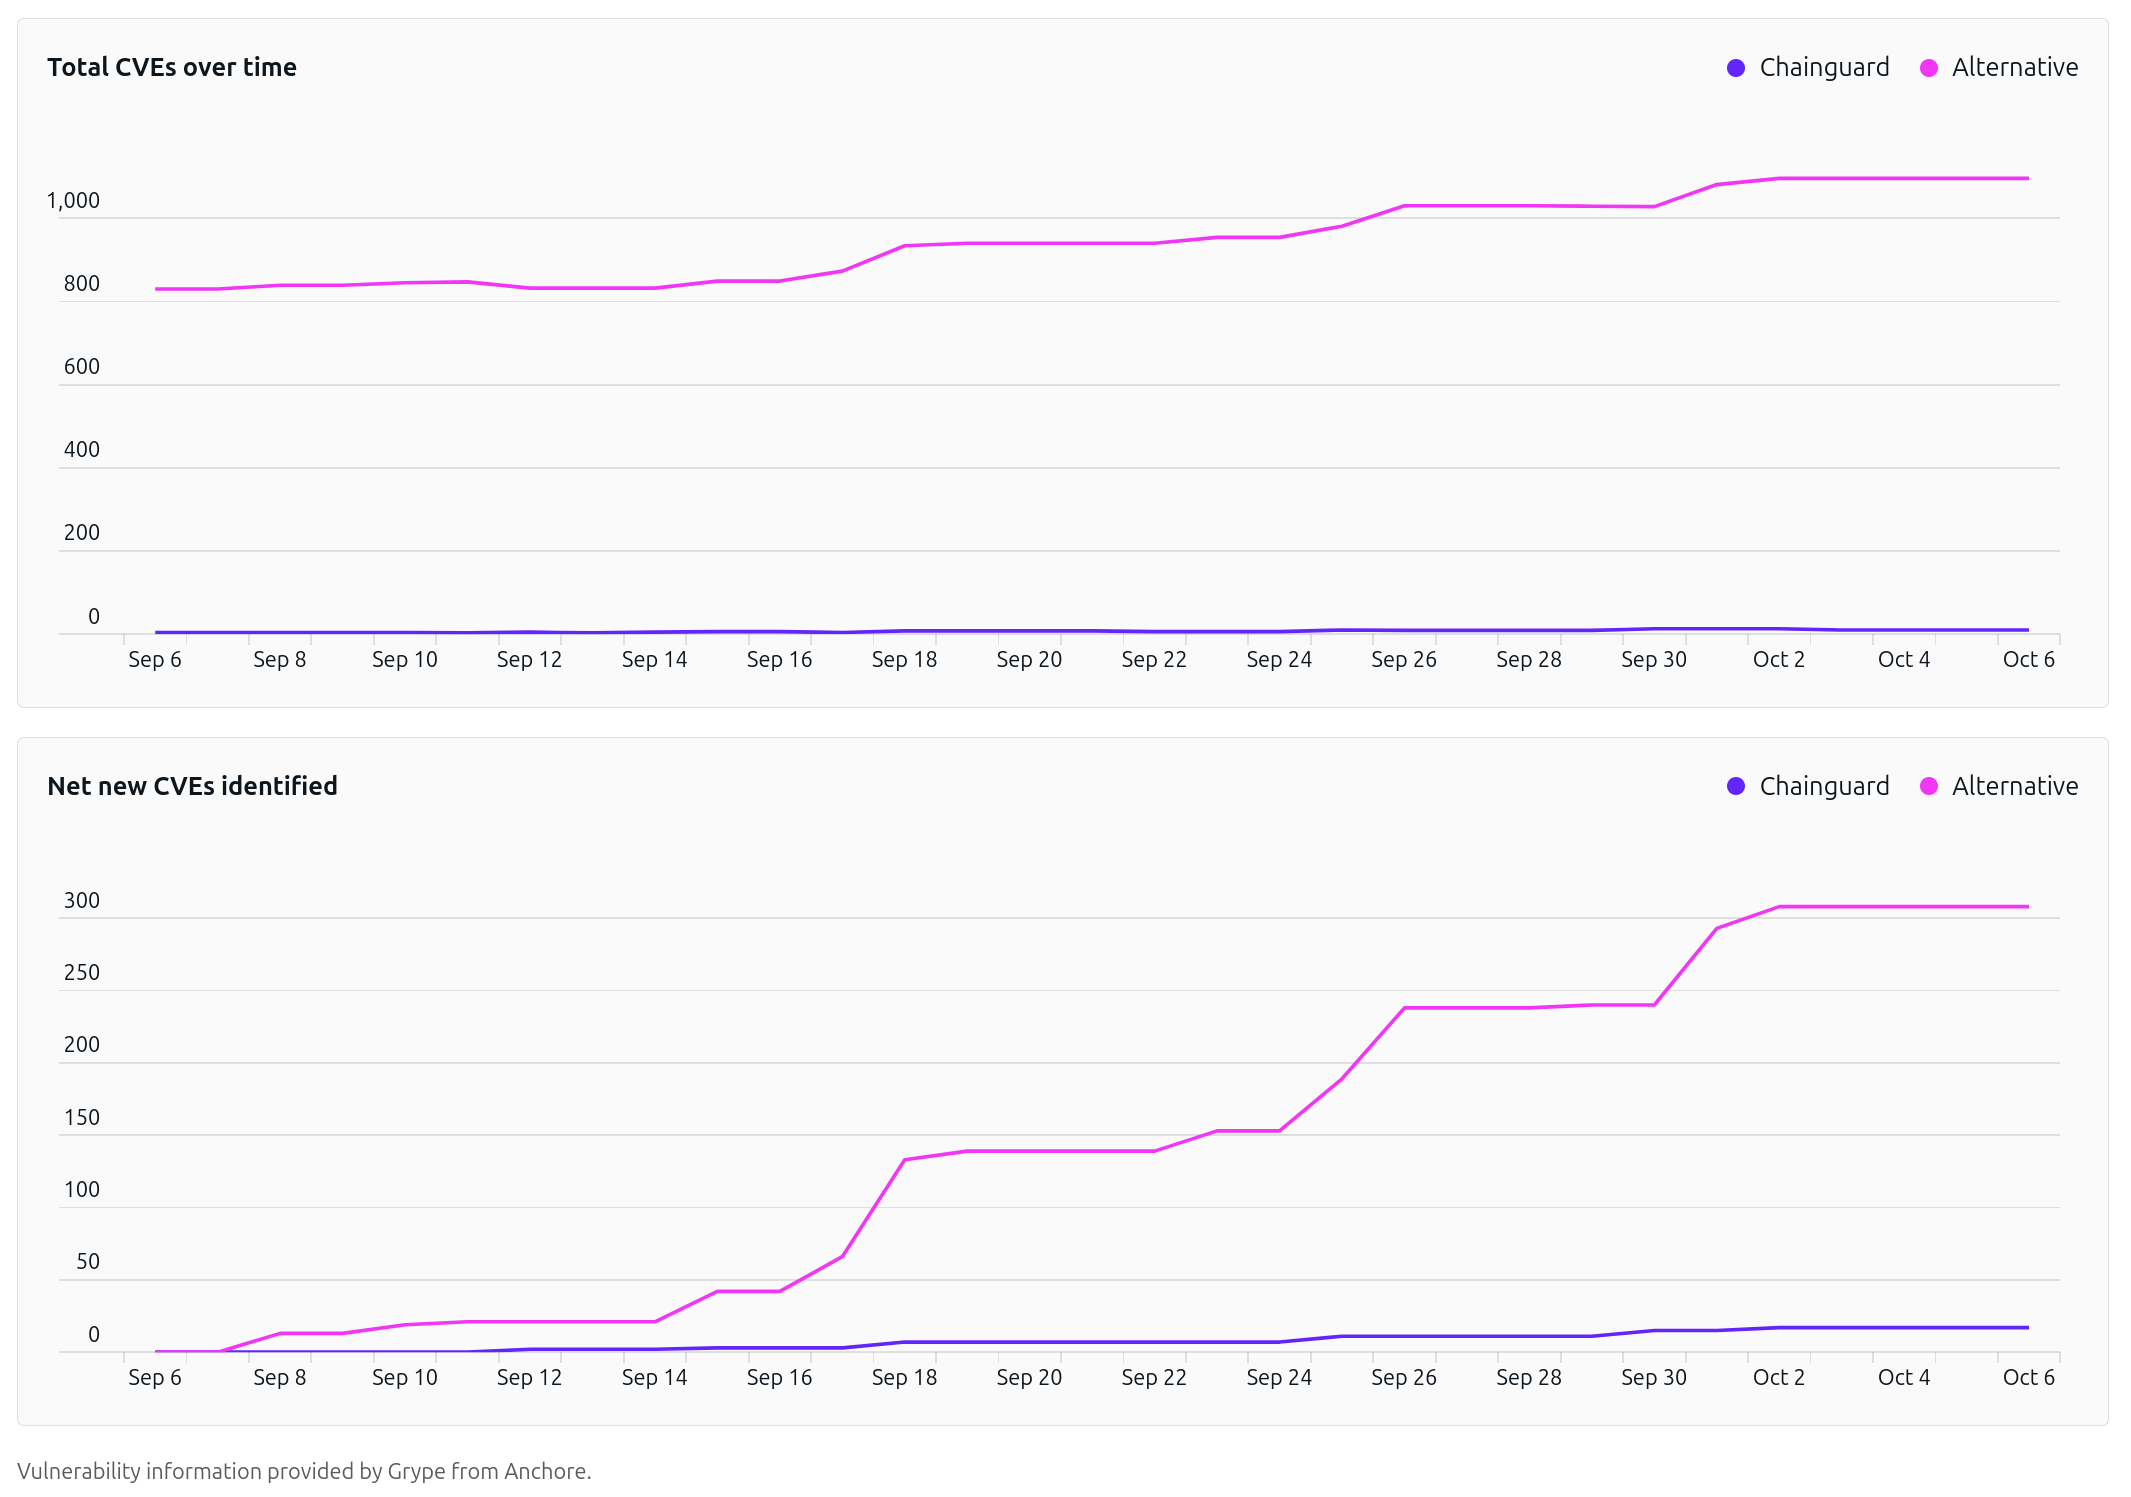
The Organization comparison tab totals CVE data across your organization’s images and compares it with their alternatives. It covers only images in your organization, not the rest of the Chainguard catalog.
Note: If you’re a member of more than one organization, you can switch organizations with the drop-down menu in the top left corner of the Console.
There are several controls at the top of the tab:
Below the controls, a summary states how many vulnerabilities the selected images eliminate compared to their alternatives. Next is a severity section titled with your image count, such as CVEs by severity for your 287 images. It has side-by-side bar graphs of the daily CVE counts for Chainguard and Alternatives over the last 30 days, color-coded by severity. Select What’s being compared? to list each image with the alternative it’s compared against.
You can find the same comparison data for a single image under Images, on either the Organization or Chainguard catalog tab. Select or search for an image.
The image opens on its Tags tab. Select the Comparison tab, which shows the same sections as the Compare images tab on the Reports page, with Alternative and Period drop-downs at the top.
Similar to the CVE reports found under Images in the Chainguard Console, you can find CVE reports for every one of Chainguard’s container images in the Containers Directory.
In the directory, select or search for any container image. The image opens on its Tags tab. Select the Comparison tab to view the CVE comparison data.
Some container images don’t have a comparable alternative. For these images, the Comparison tab shows data only for the Chainguard Container.
The Comparison tab isn’t available for customized images.
The CVE data used in these reports is from the Grype vulnerability scanner. Vulnerability data is constantly evolving, so we scan container images each day and store the results. The results shown are the vulnerabilities found on the day in question; scanning the container images again with a newer database can produce different results.
For more information on CVEs refer to What are software vulnerabilities and CVEs. You may also find our guide on Using the Chainguard Directory and Console to be of interest.
Last updated: 2026-10-05 00:00